2020 Overview Small Business Growth Index
National’s quarterly report on small business-related economic trends. This report covers small business trends from 2019 to 2020.
Executive Summary
The National Business Capital Small Business Index Growth Report is a quarterly report on small business-related economic trends. This report covers small business trends from 2019 to 2020 – taking into account the impact of the global Covid-19 pandemic and the economic recession on small businesses.
How Many Small Business Loans Were Funded in 2020?
SBA Loans in 2020
PPP Loans in 2020
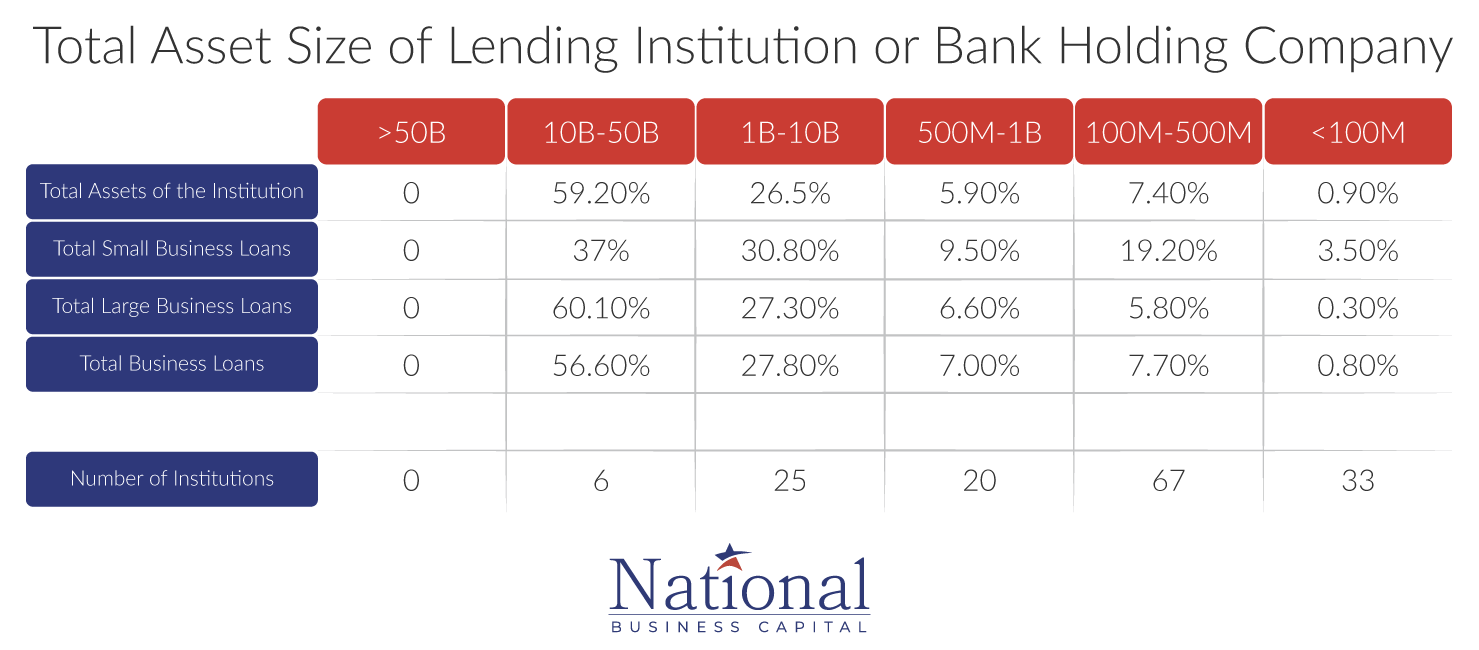
Share of Business Loans and Total Assets by Minority Lender Size, 2019
Number of Businesses by Revenue
Economic Growth by Industry
Small Business Stats by State
Unemployment
Small Business Breakdown
Sources
How Many Small Business Loans Were Funded in 2020?
How Many Small Business Loans Were Funded in 2020?
In 2019, the total of small business loans amounted to $644.5 billion (1). This period reflects the credit market before the beginning of the COVID-19 pandemic.
In response to economic fallout due to Covid-19, the federal government established the stimulus bill known as the Coronavirus Aid, Relief, and Economic Security Act (CARES Act). This provided financial relief for hard-hit small businesses through the creation of the Paycheck Protection Program (PPP) and additional funding for Small Business Administration (SBA) loans.
Overall business financing dropped during the height of the Covid-19 pandemic. Nonetheless, the majority of financing activity in 2020 concentrated on SBA loans and PPP loans.
SBA Loans in 2020
SBA Loans in 2020
In 2020, the SBA’s traditional lending programs granted slightly over $28 billion worth of loans (2). This represents a modest increase from the total guaranteed loan amount of $28 billion in 2019 (2).
The SBA’s 7(a) loan program saw a decrease in total loans issued and value amount – 42,000 worth of loans, amounting to $22.5 billion in 2020 compared to 52,000 loans totaling $23.17 billion in 2019 (3).
The SBA’s 504 loan program saw an increase in total loans issued and total funding amounts in 2020. There were 7,000 loans issued, totaling $5.8 billion in 2020 – compared to only 6,000 loans amounting to over $4.9 billion in 2019 (3). The SBA’s Microloan program issued 5,800 loans totaling $85 million in 2020 – while 5,500 loans amounting to about $85.1 million were issued in 2019 (3).
PPP Loans in 2020
PPP Loans in 2020
Initiated by the CARES Act, PPP loans are SBA-backed loans that helped businesses retain employees during the COVID-19 crisis. Borrowers may be eligible for PPP loan forgiveness, but only if they meet the requirements outlined by the SBA (4). A total of 10,858,725 PPP loans, amounting to $782.2 billion, were approved via 5,471 different lenders in 2020 (5) (6).
About 70% of all small businesses applied for a PPP loan in 2020 – this figure equates to approximately 21 million businesses (7).
About 28% of all applicants were unsuccessful in securing PPP financing. This is largely due to barriers businesses faced throughout the lender’s pre-screening processes as well as other factors. Data suggests a PPP loan approval rate of 50% or more (7) (8).
Share of Business Loans and Total Assets by Minority Lender Size, 2019
Share of Business Loans and Total Assets by Minority Lender Size, 2019
Total Asset Size of Lending Institution or Bank Holding Company
Initiated by the CARES Act, PPP loans are SBA-backed loans that helped businesses retain employees during the COVID-19 crisis. Borrowers may be eligible for PPP loan forgiveness, but only if they meet the requirements outlined by the SBA (4). A total of 10,858,725 PPP loans, amounting to $782.2 billion, were approved via 5,471 different lenders in 2020 (5) (6).
About 70% of all small businesses applied for a PPP loan in 2020 – this figure equates to approximately 21 million businesses (7).
About 28% of all applicants were unsuccessful in securing PPP financing. This is largely due to barriers businesses faced throughout the lender’s pre-screening processes as well as other factors. Data suggests a PPP loan approval rate of 50% or more (7) (8).
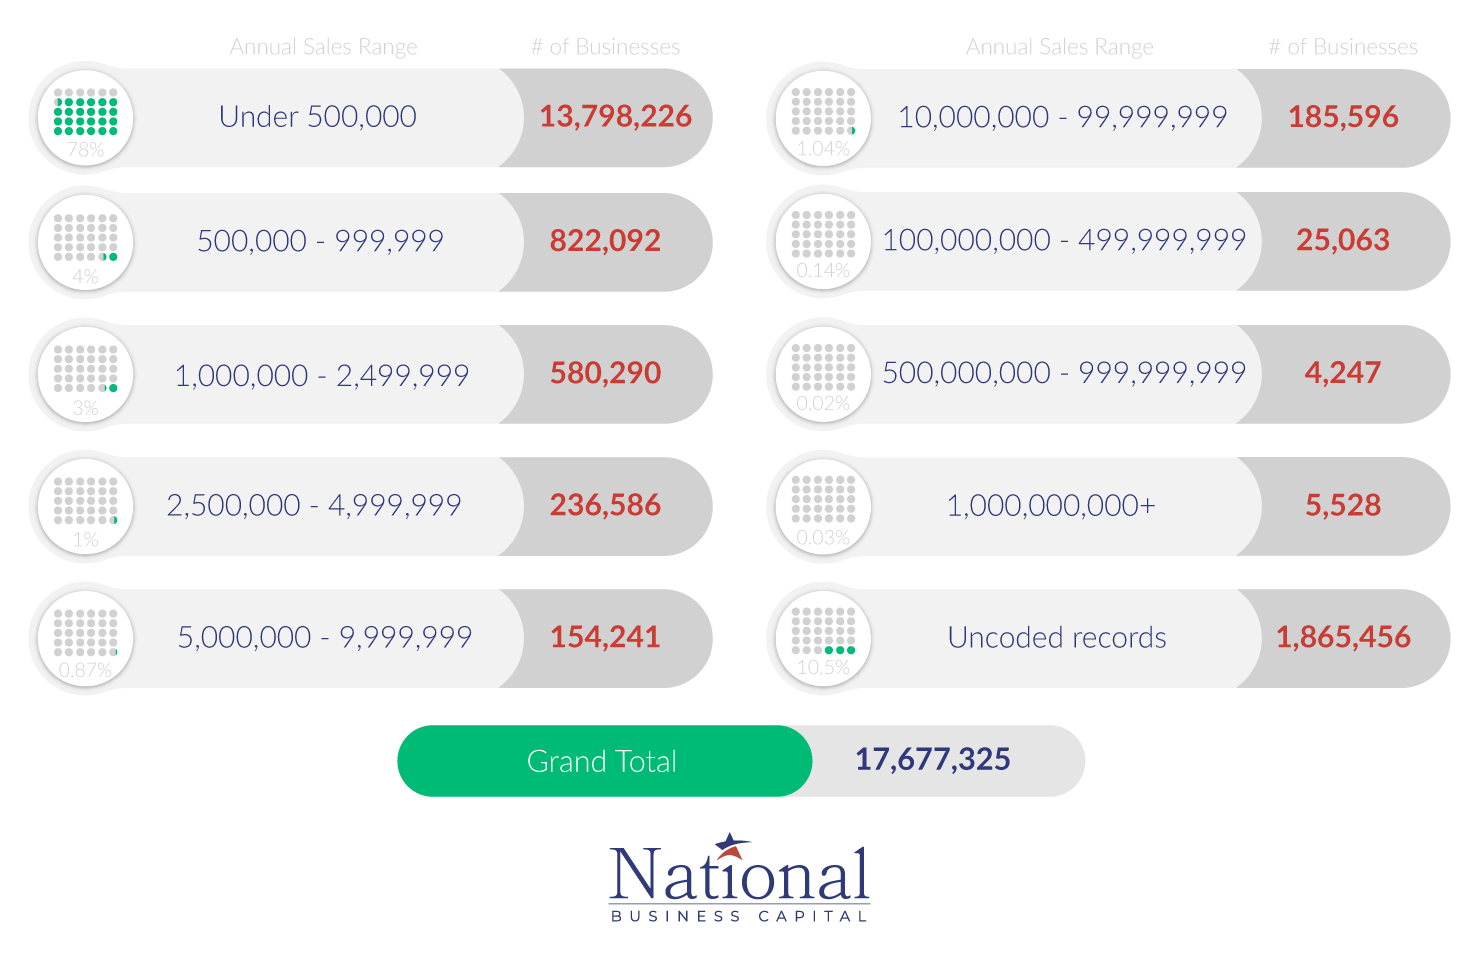
Number of Businesses by Revenue
Number of Businesses by Revenue
As of February 2021,
Economic Growth by Industry
Economic Growth by Industry
Construction
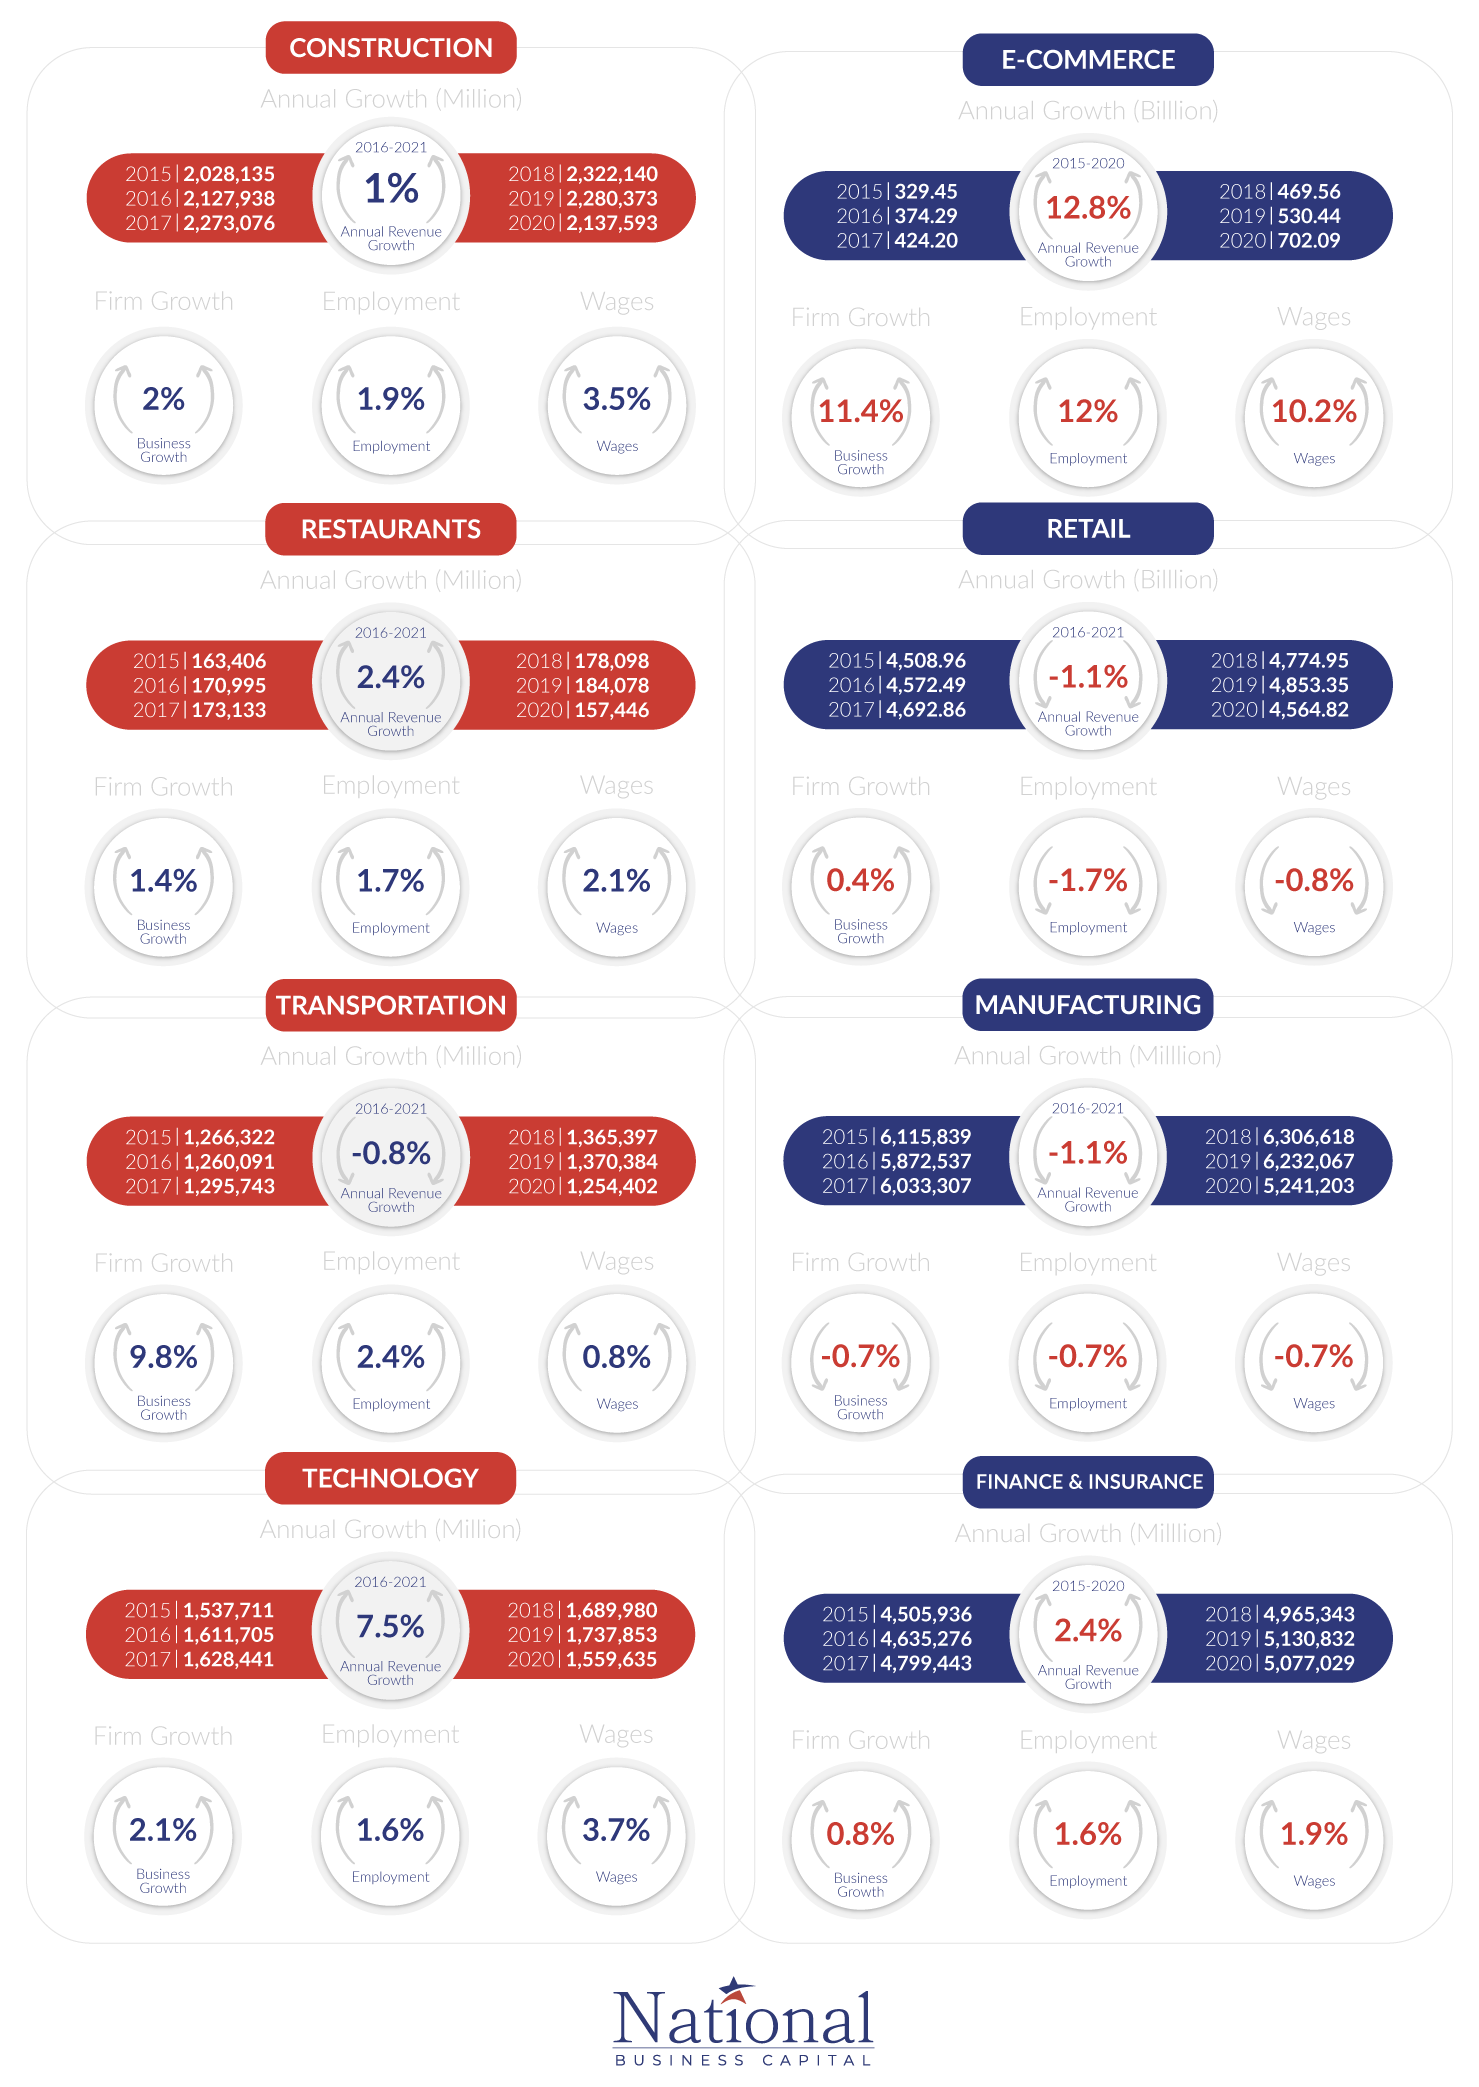
The construction industry achieved annual revenue growth of 1% from 2016 to 2021. The construction industry grew steadily for several years before experiencing slight revenue dips in 2019 and 2020. Lockdown orders stemming from the global pandemic halted most projects. However, growth is expected to recover throughout 2021 as consumer demand and the housing market surge.
The number of construction businesses grew by 2% over the past 5 years, while employment opportunities grew by 1.9% from 2016 to 2020. Construction industry wages grew by 3.5% over the same period.
E-Commerce
As lockdowns due to the global pandemic became the new normal, businesses and consumers increasingly turned to digital solutions. More people began purchasing goods and services online – accelerating digital adaptation and driving growth within the e-commerce industry. These trends are expected to continue even after the Covid-19 pandemic subsides.
E-commerce experienced a 12.8% annual revenue growth from 2015 to 2020. Businesses within the e-commerce space also grew by 11.4%, totaling approximately 249,000 firms from 2015 to 2020. Annual employment growth within the e-commerce sector averaged 12% over the past 5 years – wages also grew, by about 10.2%.
Restaurants
Restaurants were some of the hardest-hit businesses throughout the pandemic. Many restaurants were forced to close, pivot, and adapt in the wake of lockdown orders – causing revenue to decline by about 14.5% from 2019 to 2020.
Taking the 2020 decline into account, restaurant annual growth averaged 2.4% from 2016 to 2021. Employment grew 1.7%, while wages grew 2.1% over the same time frame.
Retail
The retail industry experienced -1.1% annual revenue growth from 2016 to 2021 – amounting to a loss of $5 trillion. Changing consumer preferences and a pivot towards e-commerce, especially among younger shoppers, have damped revenue. The Covid-19 pandemic also accelerated this decline.
The amount of new retail businesses grew by a modest 0.4% from 2016 to 2021. Overall wages were lowered by -0.8% over the same timeframe.
Transportation
The transportation sector declined by -0.8% over the past 5 years – falling to $1.2 trillion in annual revenue. The industry relies heavily on long-term contracts and is subject to volatile input costs – both of which impede growth. Furthermore, many countries closed borders and limited transportation during the Covid-19 pandemic. As supply chains were disrupted, the transportation sector was slowed.
Nevertheless, new businesses grew by 9.8% – totaling 3 million from 2016 to 2021. Employment within transportation continues to grow – achieving 2.4% year-over-year growth, while wages rose 0.8% from 2016 to 2021.
Manufacturing
The global pandemic spurred production downturns and forced factory closures. The manufacturing sector had already been experiencing fluctuations in growth before 2020, primarily due to trade disputes and competition from overseas. Annual revenue growth for the manufacturing industry dropped -1.1% from 2016 to 2021 – falling to $5.6 trillion in revenue.
The global pandemic also contributed to a dip in manufacturing employment levels. Employment fell -0.7% from 2016 to 2021, and wages also decreased at the same rate of -0.7%.
Technology
The information technology (IT) sector remains robust. The industry experienced 7.5% annual revenue growth from 2016 to 2021 – amounting to 285.3 billion. Even though the Covid-19 pandemic disrupted electronics supply chains, the industry is positioned to expand over the coming years – especially due to increased digitalization.
The number of IT businesses grew by 2.1% from 2016 to 2021 – totaling 459,000 firms. Employment opportunities within IT also rose 1.6% over the past 5 years, while wages grew by 3.7%.
Finance and Insurance
The finance and insurance industry saw a 2.4% revenue boost from 2015 to 2020 – totaling $5.1 trillion in revenue. Although suffering a slight dip due to the Covid-19 pandemic, the industry is positioned to recover throughout 2021.
Finance and insurance firms grew by 0.8% from 2015 to 2020 – totaling 995,000 new businesses. Wages also rose 1.9% over this timeframe.
Small Business Stats by State
Top 5 States For Small Business Growth
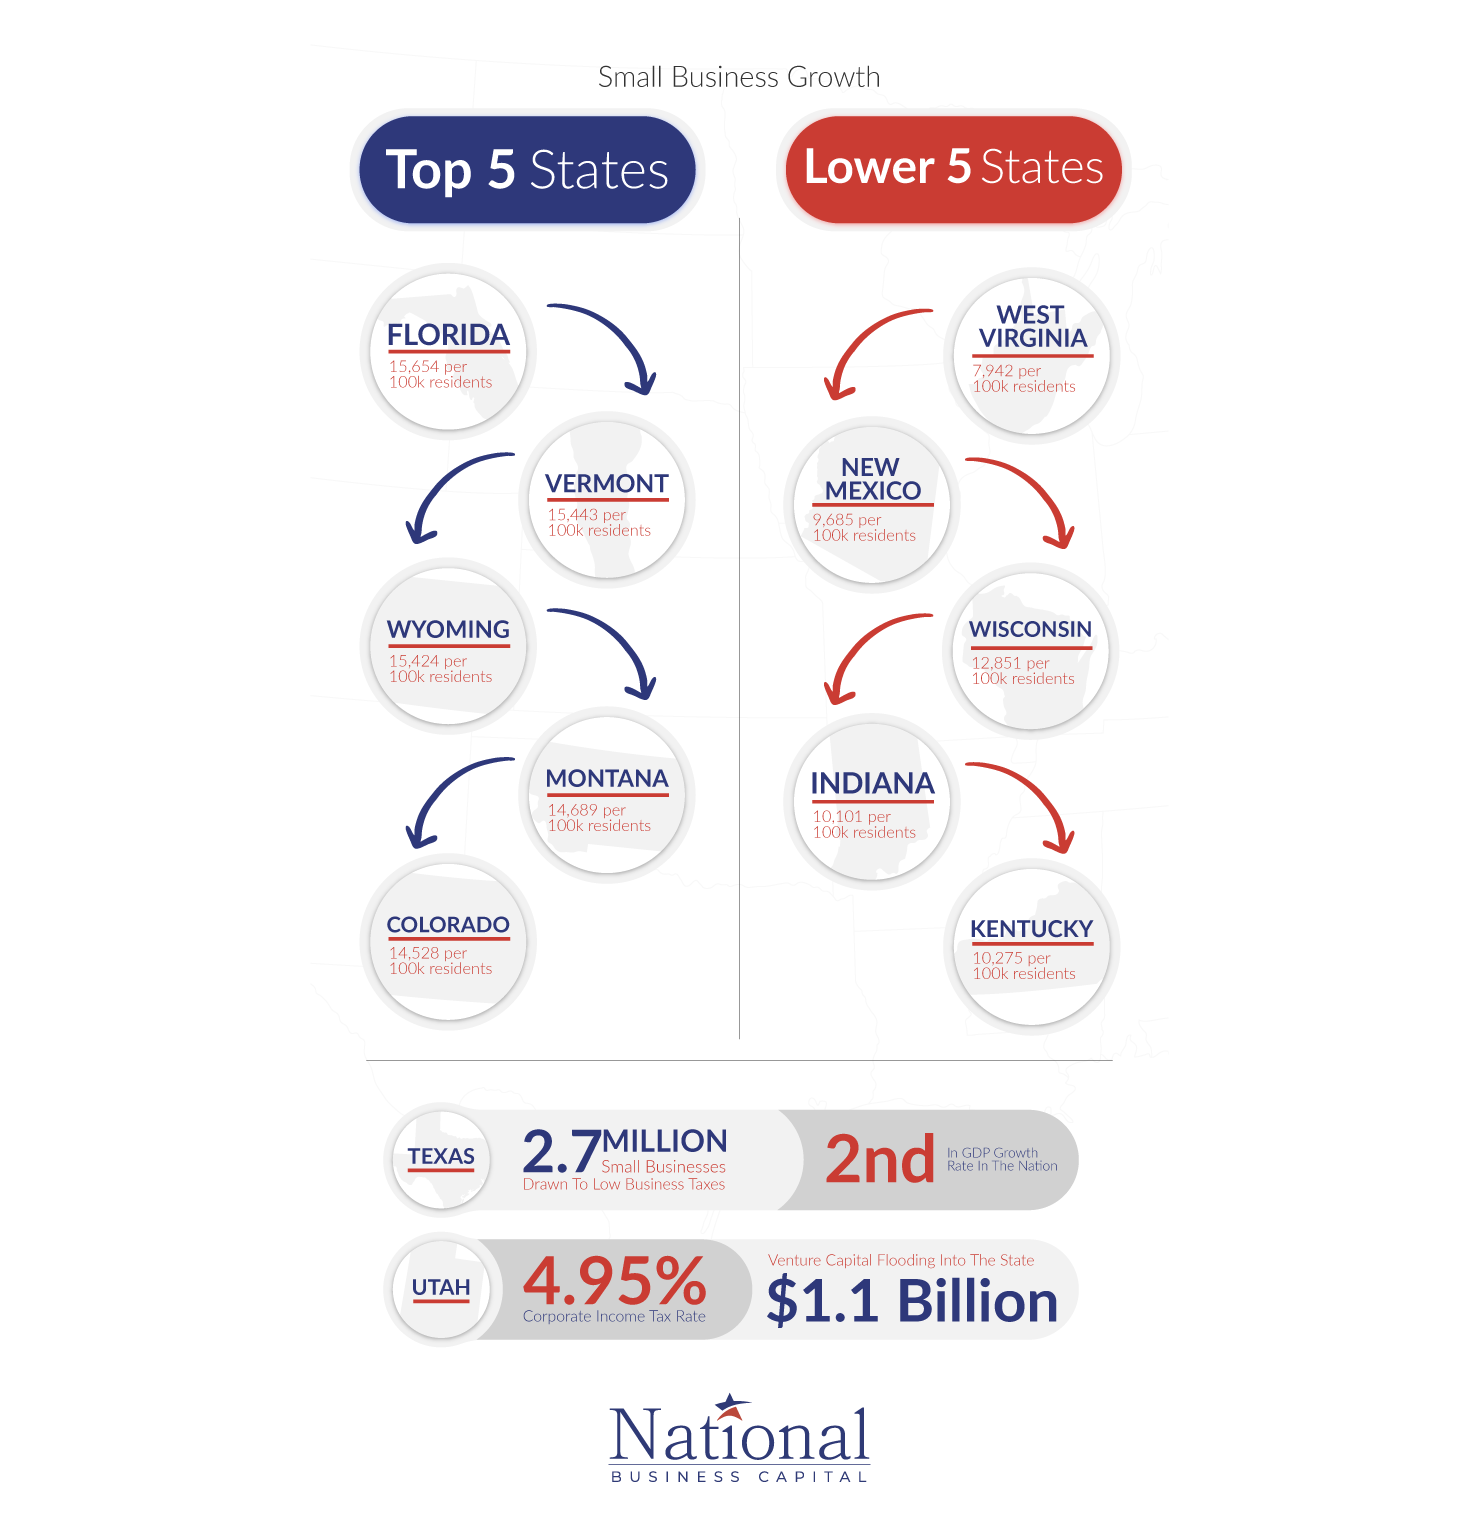
The top 5 states for small business growth include Florida, Vermont, Wyoming, Montana, and Colorado. Factors such as a favorable small business tax climate, low labor costs, a skilled labor force, and entrepreneurial concentration have attributed to robust growth.
Lowest 5 States For Small Business Growth
West Virginia, New Mexico, Wisconsin, Indiana, and Kentucky have experienced the slowest rate of small business growth. Wisconsin and Indiana both maintain slightly higher than average corporate tax rates of 7.9% and 9.5%, respectively. While lower education levels, unskilled labor, poor infrastructure, and strict regulatory environments also impede entrepreneurship.
Other States of Significance
Texas: The second-largest state in the country in terms of GDP growth, Texas maintains low business taxes, strong infrastructure, and robust urban areas with a skilled workforce. These factors have successfully drawn over 2.7 million small businesses to the state (9).
Utah: Has seen significant small business growth in recent years due to its low corporate income tax rate of 4.95% and an inpouring of venture capital – totaling approximately $1.1 billion. Utah has become a haven for new startups and maintains a promising environment for small businesses (9).
Unemployment
Unemployment
Small Business
The Covid-19 pandemic and subsequent lockdown orders closed millions of businesses, both temporarily and permanently – ultimately forcing companies to hold off hiring.
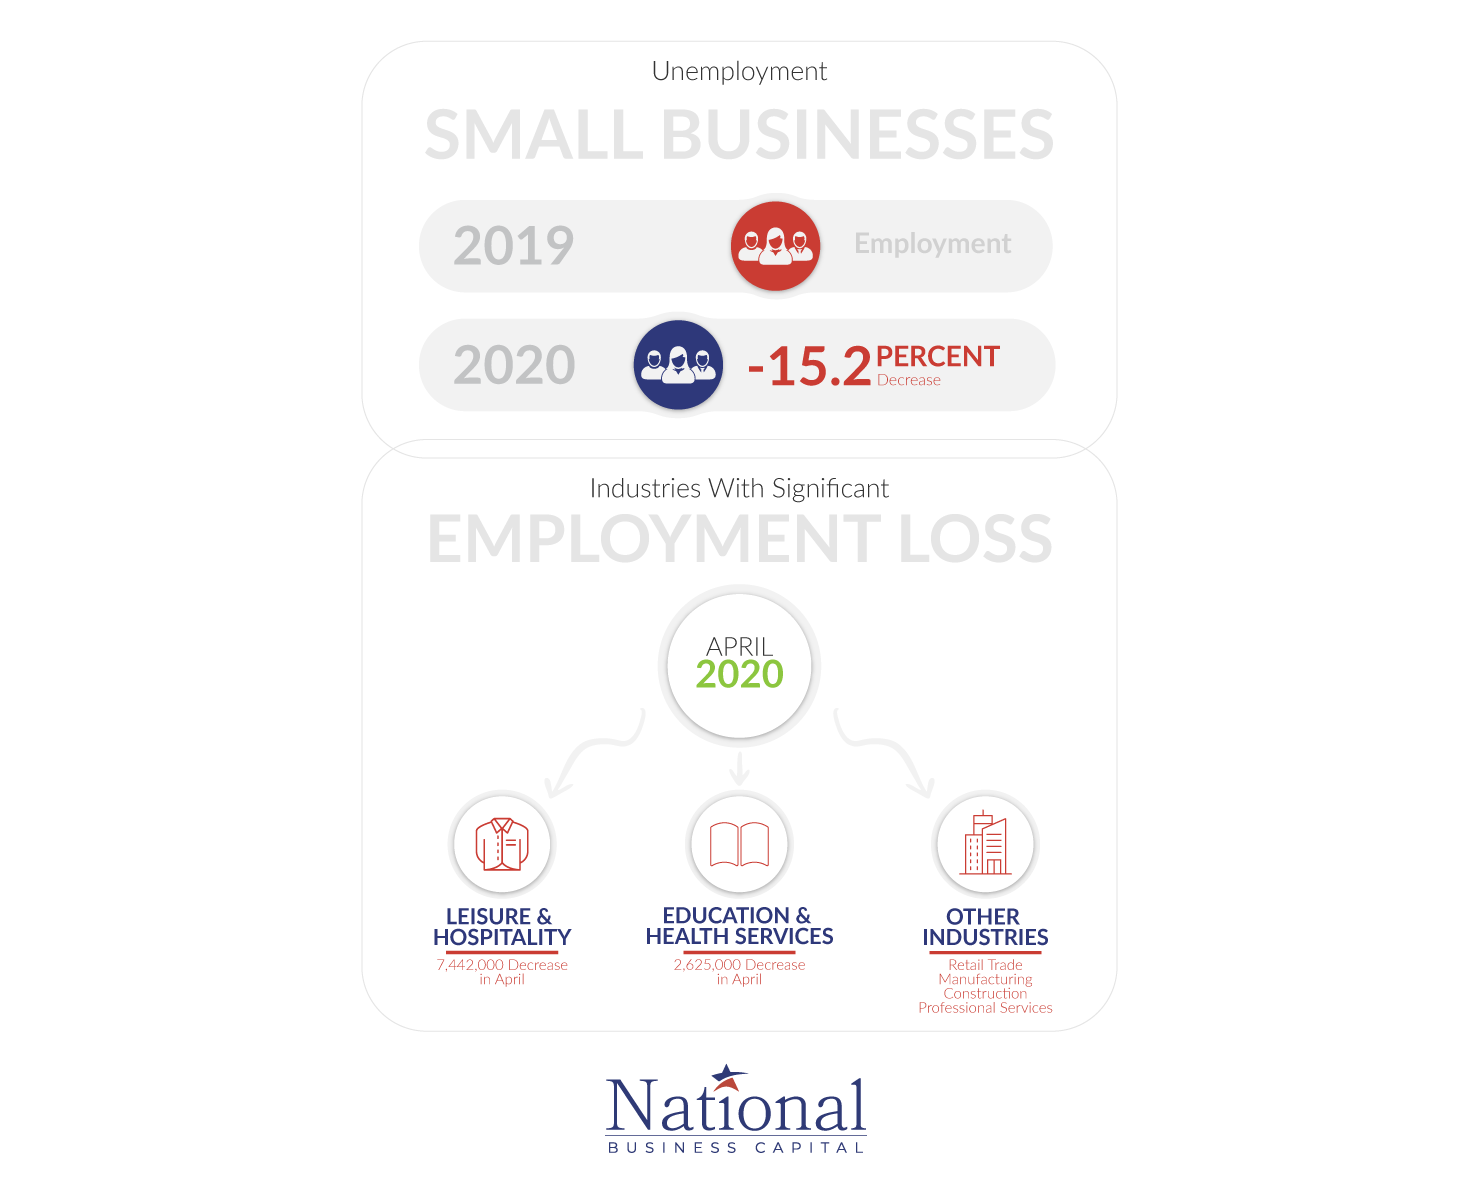
The disruption produced record rates of unemployment across all sectors of the economy, but small businesses were hit especially hard. Jobs at small businesses decreased by 15.2% from 2019 to 2020.
Industries of Significant Employment Loss
The Covid-19 pandemic had a stronger impact on some industries than others. The leisure and hospitality industry showed the biggest loss of employment in 2020 – with a drop of 7,442,000 employees in April of that year. Education and health services saw a total loss of 2,625,000 jobs in April 2020 (10).
Retail, manufacturing, construction, and professional services industries all suffered varying degrees of pandemic-induced disruption, which subsequently offset hiring and employment opportunities (11).
Small Business Breakdown
Small Business Breakdown
The Covid-19 pandemic resulted in the permanent closure of approximately 130,000 small businesses (12). While significant, this figure is lower than what some economists initially feared during the onset of the crisis.
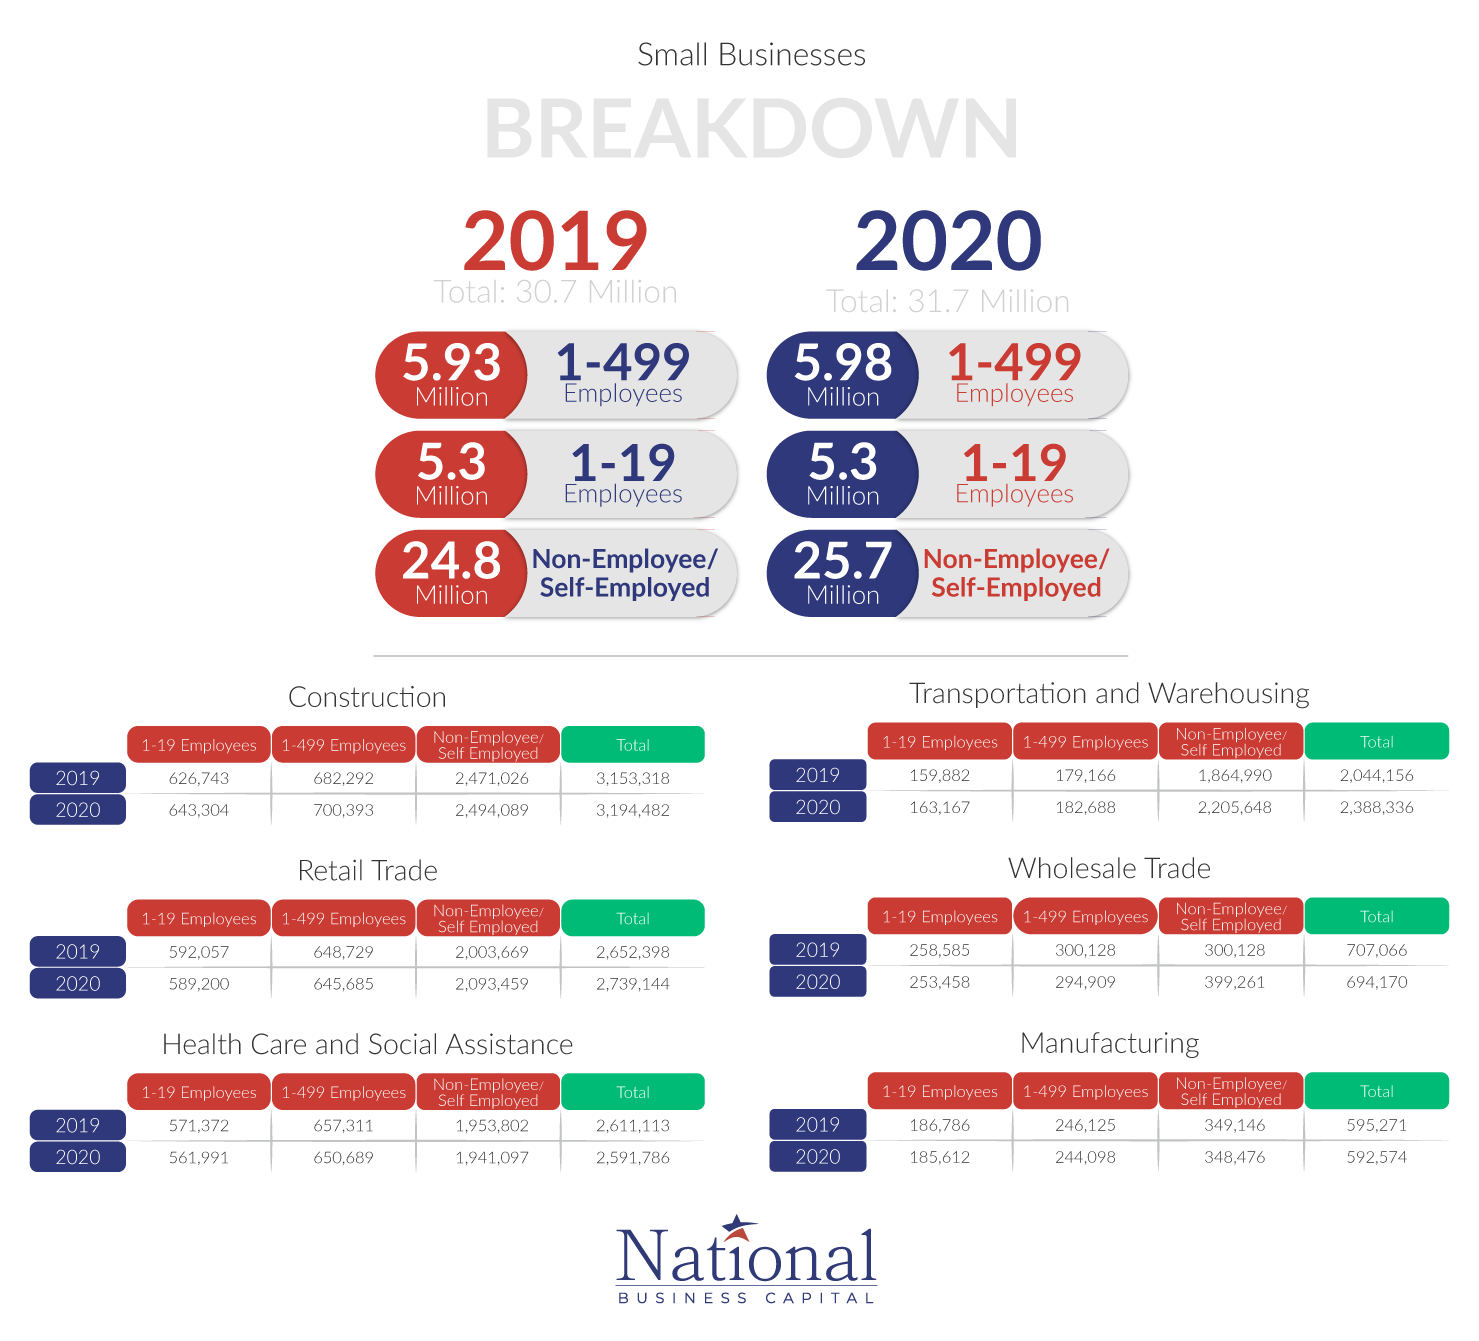
Extensive government aid, PPP loans, adaptation to new business models, and digitization all played a role in helping small businesses stay afloat throughout 2020. As a result, the number of small businesses between 2019 to 2020 actually increased by about 3.3% – from 30.7 million to 31.7 million.
Real estate, professional services, information technology, and transportation all saw significant levels of small business growth – largely driven by an increase in self-employed enterprises. Other industries, such as construction, retail trade, finance and insurance, and education services, saw modest levels of growth.
Health care and social assistance, wholesale trade, manufacturing, agriculture, and utilities saw the biggest drop in the number of active small businesses.
Lending & Credit
Many businesses relied heavily on PPP loans and other government-backed loans to stay afloat throughout the Covid-19 pandemic. However, private lenders made requirements more rigid, and many pulled back financing. Only 32% of all small business owners reported borrowing on a regular basis, a 3 percentage point from the previous year (14).
About 72% of borrowers indicated that all their credit needs were currently met. While 2% of business owners indicated that their borrowing needs were not met or satisfied (14).
Of all small businesses, 59% reported capital outlays within the past six months, out of that spending, 41% indicated it went to new equipment, 26% purchased vehicles, 14% invested in their facilities, 6% acquired property, 11% invested in fixtures and furniture (14).
Executive Concerns
Many business executives believe the ongoing COVID-19 pandemic is the single biggest risk to economic growth – followed by high levels of national debt, supply-chain disruptions, and asset bubbles (15).
Small business owners, about 66.37%, are most concerned about losing work – clients, projects, and sales. 59.21% of small business owners found customer traffic to be a significant concern, while 53.79% maintained they were worried about employee financial welfare. 54.54% of small business owners indicated that they were afraid of not being able to pay rent or mortgages.
Decrease in Revenue
An overwhelming majority of business owners, 90%, reported a loss of revenue as the biggest impact of COVID-19 (16). 56.86% of businesses found their revenue decreased by more than 75% since March 2020. Over 15% said that their business revenue decreased between 50 to 75% over the past year.
Positive Momentum
The economy is rebounding as vaccinations have become more prevalent, and social distancing orders are falling off. Heightened consumer demand and low-interest rates will continue to be the primary drivers of growth.
Global business executives are seeing a positive momentum building in the global economy and in their home countries. About 50% maintain that the economy is currently “moderately better” than it was 6 months ago. Nevertheless, inflation and a lack of skilled labor will pose challenges for small businesses moving forward.
Sources
Sources
- https://advocacy.sba.gov/2020/09/10/small-business-lending-in-the-united-states-2019
- https://www.sba.gov
- https://www.sba.gov/funding-programs/loans/covid-19-relief-options/paycheck-protection-program/ppp-loan-forgiveness
- https://data.sba.gov/dataset/ppp-foia
- https://projects.propublica.org/coronavirus/bailouts
- https://www.nfib.com/content/press-release/economy/70-percent-of-small-businesses-applied-for-ppp-loans-nearly-half-applied-for-eidl
- https://www.sba.gov/funding-programs/loans/covid-19-relief-options/paycheck-protection-program/ppp-data
- https://howtostartanllc.com/start-a-business/best-states-to-start-a-business
- https://www.bls.go
- https://www.bls.gov/news.release/pdf/empsit.pdf
- https://www.federalreserve.gov/econres/feds/files/2020089r1pap.pdf
- http://www.nfib-sbet.org
- https://www.nfib.com/surveys/small-business-economic-trends
- https://www.mckinsey.com/business-functions/strategy-and-corporate-finance/our-insights/the-coronavirus-effect-on-global-economic-sentiment
- https://higherlogicdownload.s3.amazonaws.com/NMSC/390e0055-2395-4d3b-af60-81b53974430d/UploadedImages/Resource_Center/COVID_19/NMSC57_MSA_COVID19IMAPCTSURVEY_F.pdf
National Business Capital
Accelerate your success with frictionless financing and expert advice that breaks down the barriers to growth for every entrepreneur.
Thrive with access to a business lending marketplace that’s built for entrepreneurs, by entrepreneurs. Experience a time-saving machine that cuts approval times from months to hours. Leverage an extensive network of over 75 lenders and teams of expert financing advisors to ensure you’ll always have access to the capital that best fits your business.
Working with NBC, gain a financing partner for the future, ensuring your business has the capital it needs to seize every opportunity and grow without limits.
National Business Capital. Grow to Greatness.
Ready to See Your Options?
Go from application to approval in hours, not days, with a streamlined process that merges high-tech with human-touch for high-efficiency financing.


