


Table of contents
Acquiring and driving a typical passenger vehicle is generally cheaper in the Eastern half of the country, with the Midwest, in particular, offering drivers a better deal.
NationalBusinessCapital.com’s second annual report on the Best States To Buy And Operate A Car remains a snowy grudge match between the Midwest and the Northeast, regions that can probably use some breaks with stagflation looming. There has, however, been a small shake-up in the state rankings. The best deals on used cars are in the Northeast, with Delaware (4th) offering a median listing of $7,995. Though prices in Midwestern states are slightly higher on average, the region makes up ground with generally lower sales taxes, insurance costs, and better road conditions, the latter of which is a new consideration for our report. Midwestern states that also had cheap used vehicles performed particularly well, with Ohio (1st) and Indiana (2nd) edging out last year’s champion, Vermont (3rd).
In the middle of the pack is the South, which generally enjoys low gas prices, but often packs on hidden costs in the form of personal property taxes, high sales taxes, and/or less restricted dealer documentation fees. Southern states with more modest ad valorem burdens, like Kentucky (7th), tend to perform better overall.
As for the West, drivers in Mountain and Pacific States are generally burdened by high listing prices for used cars and tend to pay a premium at the pump. States from these regions, including Arizona (50th), Nevada (48th), Colorado (46th), and California (45th), dominate the bottom of the ranks.
Key findings
- The Midwest Is The Best Overall Region In Which To Own A Car: Midwest states made a strong showing in 2025, led by Ohio and Indiana. The region had an average overall score of 59.5, followed by the Northeast with 55.9, the South with 50.2, and the Pacific with 43.4. Mountain states finished pretty far behind with an average score of 38.8.
- Pacific States Pay Far More For Gas Than Other Regions: With an average gas price of $4.24 per gallon, 26% higher than the Mountain region (the next most expensive) and 47% higher than the South (the cheapest), drivers in Pacific States are paying far more to fill their tanks than the rest of America. This contributed to Washington (44th), California (45th), and Hawaii (47th) finishing in the bottom 10. California had the highest average gas prices at $4.61 per gallon. No Pacific State finished in the top 10.
- The Northeast Has The Best Deals On Cars: Used car listing prices are the lowest in the Northeast at an average listing price of $14904, around 10% lower than the Midwest at $16,547, and 70% lower than that of the Mountain West at $25,407. Northeast states finishing among the Top 10 include Vermont (3rd), Delaware (4th), Massachusetts (8th), and Pennsylvania (9th). Contributing factors to lower car prices include proximity to distribution points, higher population density, and the availability of competing modes of transportation. Weathering may also contribute to vehicle depreciation.
- Owning And Operating A Car Is More Expensive Out West: Of the bottom 10 states, only one, Maryland (41st), was located east of the Mississippi. Used car prices were generally higher out West, adding major upfront costs to getting on the road.
- The Midwest Has The Least Bumpy Roads: With an average acceptable road rating of 88.1%, the Midwest is the easiest on suspensions, followed by the South at 84%, the Mountain West at 83.6%, the Northeast at 76.9%, and the Pacific region at 73.9%.
THE 10 CHEAPEST STATES TO
BUY AND OPERATE A CAR
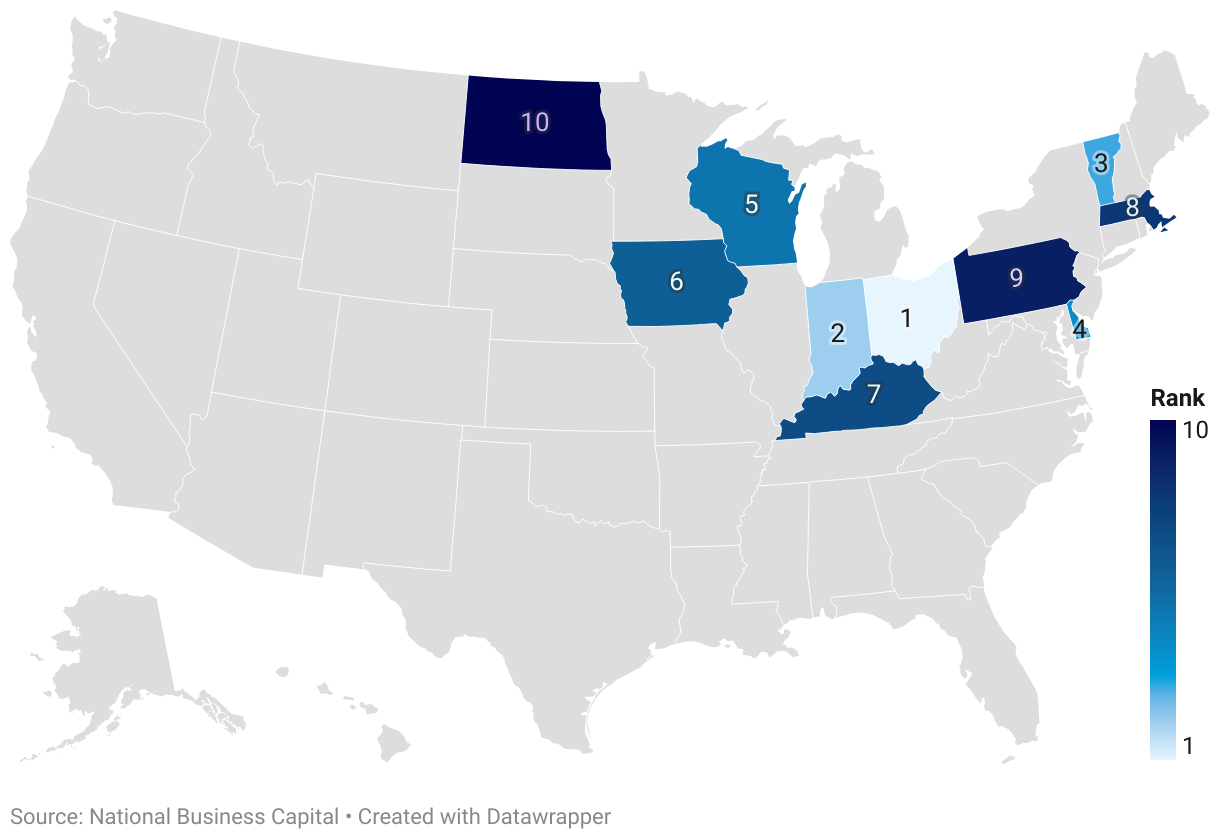
1. Ohio

Score (out of 100): 77.8
Previous Rank: 2 (+1)
Ohio, 2024’s runner-up, steals first place from Vermont in 2025. While the Buckeye State didn’t finish first in any one category, it did manage to put together a winning combination of low new (11th, dealer doc fees) or used car prices (median $12,995, 6th) and insurance costs (7th) without piling on too many recurring fees or taxes (4th).
Very heavy drivers may see some diminishing returns driving in Ohio over time, however, due to just slightly better than average gas prices (21st) and road conditions (21st).
2. Indiana

Score: 76.2
Previous Rank: 6th (+4)
The Midwest clinches the top two spots as Indiana rises four ranks to number two in 2025. Your mechanic may not like it if you drive in Indiana, but your car will appreciate the lower wear and tear, thanks to 97.4% of the state’s roads being in acceptable condition (1st). You’ll also probably pay less in insurance (5th). The median used car listing is a relatively low $13,741 (9th), and dealer doc fees won’t add too much cost to a new car purchase (7th).
On the other hand, Hoosiers have been feeling a bit more pain at the pump than the average American (35th), so you may want to avoid driving a gas guzzler long distances.
3. Vermont

Score: 72.3
Previous Rank: 1st ( -2)
Dethroned but still a contender, Vermont ranks third in 2025, losing ground to Ohio and Indiana in the used car pricing department (median $14,995, 12th). Depending on the price tag, however, your final bill may still come out lower in the Green State thanks to its slightly lower sales tax (9th) and comparable dealer doc fees (9th). Smooth mountain roads should also help keep your maintenance costs down (94.9% acceptable, 5th).
The biggest pain point for Vermonters will be higher-than-average gas prices (33rd), so you may want to consider a hybrid.
4. Delaware

Score: 70.7
Previous Rank: 4th (+0)
Delaware holds on to its number four spot thanks to its almost shockingly cheap median used car listing price ($7,995, 1st), lack of sales tax (1st), and low revolving fees (2nd), all of which make it quite easy to get a car on the road. The advantages are slightly less pronounced with new cars, which can potentially add nearly $500 to your ticket price (33rd), but the lack of sales tax more than makes up for it.
So what’s the catch? Insurance tends to take a big chunk out of Delaware drivers’ wallets (44th).
5. Wisconsin

Score: 65.3
Previous Rank: 7th (+2)
The Badger State climbs two places to number five thanks to its generally modestly priced automotive culture. Sales tax (average 6%, 9th) won’t add too much extra cost to your vehicular purchase, nor will dealer doc fees (15th). Gas prices (16th) and insurance costs (10th) also help keep annual costs low.
Title fees in Wisconsin do drive up the cost of registration (32nd), however, and with nearly 1-in-4 roads in poor shape (37th), you may be replacing your suspension more often than you want.
6. Iowa

Score: 64.6
Previous Rank: 11th (+5)
After just missing 2024’s top 10 list, Iowa elbows its way in all the way to 7th place in 2025. Low gas prices (9th) and insurance costs (8th) help potentially save Iowans thousands of dollars a year. While used cars are just slightly cheaper ($17,315 median, 21st) than the national average, new cars will generally run under $200 in dealer documentation fees (6th). The roads are just slightly less flat than the terrain, with 91.3% in acceptable shape (13th).
However, be prepared for Iowa’s registration fees, which include a weight tax (43rd), to add a few extra hundred dollars to your annual costs.
7. Kentucky

Score: 63.2
Previous Rank: 25th (+18)
Kentucky takes a massive leap from the middle of the pack all the way to number 7, thanks in large part to more competitive used car listings ($15,900, 16th), and the downstream effect those prices have on the Bluegrass State’s recurring ad valorem taxes (7th). Sales tax, at an average of 6% (9th), won’t add too much cost to a used car purchase, but dealer doc fees on new cars can get a bit obnoxious (31st).
Relatively good gas prices (14th) and road conditions (14th) will hopefully reduce some of the annual pain from Kentucky’s brutal car insurance costs (46th).
8. Massachusetts

Score: 62.8
Previous Rank: 33rd (+25)
The 2025 top 10’s most improved, Massachusetts, rockets up to number 8 from the bottom half of the chart. So what’s different this year in the Bay State? Gas prices are down in both relative and absolute terms, moving Massachusetts to the cheap side of average (24th). The Commonwealth also has fairly affordable standard insurance (9th), which can be one of the largest annual costs of car ownership. And, like most of the Northeast, used cars are on the cheaper side ($14,995, 12th).
Fees and supplemental taxes (including an annual excise tax) remain on the high side (27th), however, and dealer documentation fees add substantial costs to new cars (32nd).
9. Pennsylvania

Score: 62.7
Previous Rank: 5th (-4)
Pennsylvania takes a small hit from our tweaks to methodology this year, losing some ground in part to its poor road conditions (42nd). It’s not all bad news, however, as the median used car in the Keystone State costs less than $250,000 (3rd), with sales tax not adding too big a burden (9th). Fees and insurance costs are also both moderate (19th for each).
New cars aren’t quite as good a bargain thanks to relatively high documentation fees (30th), and high gas prices (41st) could make driving inefficient vehicles painful.
10. North Dakota

Score: 62.6
Previous Rank: 23rd (+13)
The Western-most state to make the top 10, North Dakota can make a case for being a good state in which to buy a new car, given its relatively low documentation fees (15th), moderate sales taxes (23rd), and lack of ad valorem taxes and high recurring fees (6th). And with 93.3% of North Dakota roads being in decent shape (9th), residents shouldn’t be making too many gratuitous trips to the mechanic.
The value proposition isn’t as good where used cars are concerned, however, with the median listing coming in just under $20,000 (31st).
THE WORST STATES TO
BUY AND OPERATE A CAR
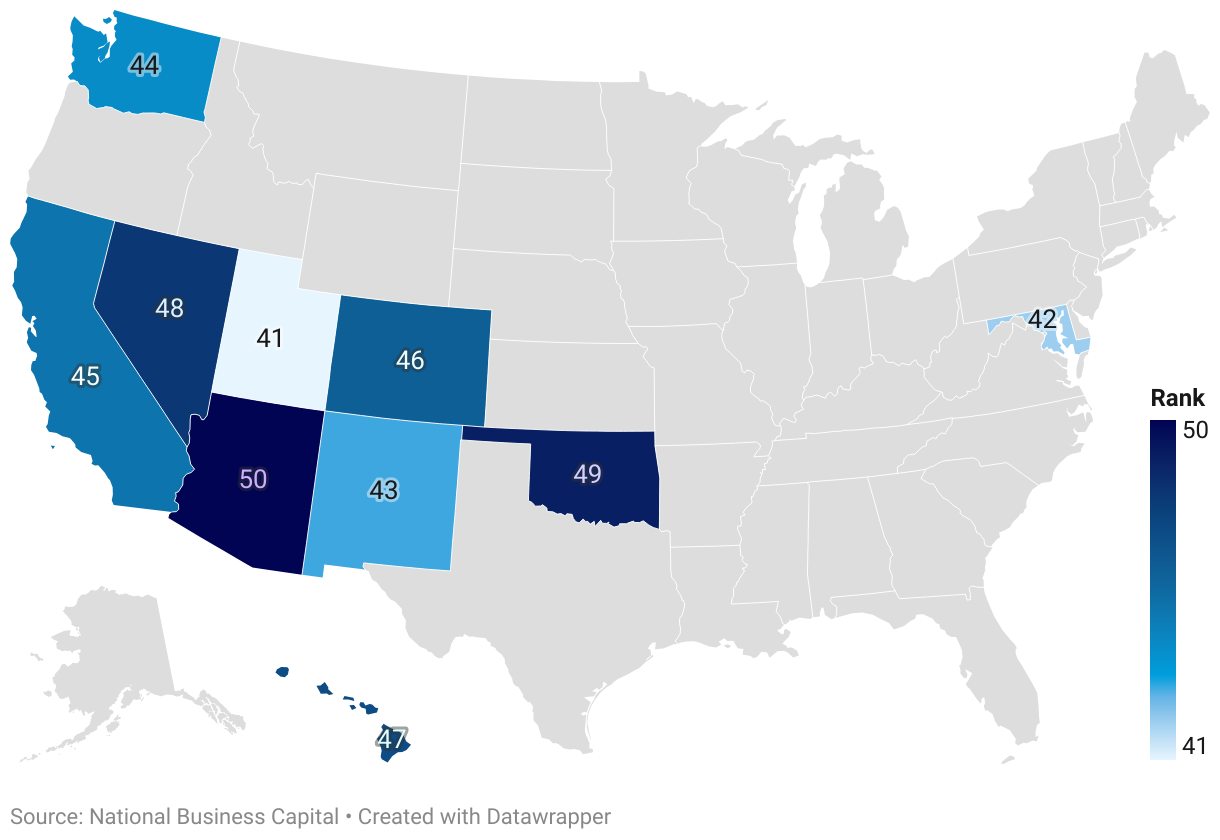
41. Utah
(Score: 41.5 out of 50; -6 ranks from 2024)
Used cars in the Beehive state offer little savings ($28,980, 47th), and high gas prices (40th) can take the joy out of driving. State fees are on the low side (11th), however.
42. Maryland
Score: 41.4, -21
Average used car prices ($18,699, 25th) and low sales tax aren’t enough to make up for high insurance costs (42nd) and poor road conditions (44th) in Maryland.
43. New Mexico
Score: 40.7, -29
New Mexico proves a casualty of factoring road conditions into our new methodology, with a third of roadways in unacceptable condition (48th), and residents are paying a premium for used cars ($26,439, 46th). The state doesn’t charge much in the way of fees (3rd), however.
44. Washington
Score: 40.4, +2
Washington remains stuck in the bottom 10 thanks to average gas prices being well over $4 per gallon (48th), high sales taxes (40th), and plentiful fees (34th), especially for those living in and around Seattle. Luckily, some savings can be realized on insurance (2nd).
45. California
Score: 39.2, +4
No state puts more restrictions on dealer documentation fees (1st) than California, and used cars are on the cheap side for the West Coast ($18,995, 28th), but those are about the only breaks drivers will get in the Golden State. Gas is notoriously expensive (50th), sales tax is high (40th), and Californians pay personal property tax (33rd, fees and taxes) on top of it all.
46. Colorado
Score: 34.0, +2
Colorado finishes in the bottom 50% in all but one of our metrics, including gas prices (39th) and insurance (38th). State fees aren’t particularly high (23rd), but they also don’t offer much relief.
47. Hawaii
Score: 33.1, -29
The island state, perhaps reasonably, is not a driver’s paradise. Roads are the second roughest in the nation (60.9% acceptable, 49th), and Hawaiians pay a pretty penny for used cars ($25,711, 45th), gas (49th), and weight fees (47th, fees and taxes).On the bright side, insuring a car is cheap (1st).
48. Nevada
Score: 28.6, +2
Creeping up from last place is Nevada with its high gas prices (46th), insurance costs (41st), and governmental service taxes (39th, fees and taxes). The roads aren’t in terrible shape, at least (22nd).
49. Oklahoma
Score: 28.2, -23
You’ll need to drive a lot of miles on cheap Oklahoma gas (3rd) to make up for the high cost of cars (used, 41st; dealer doc fees 43rd), fees (49th), and insurance (34rd). Just choose your roads carefully (73.1% acceptable, 41st).
50. Arizona
Score: 13.9, -7
From expensive used cars ($29,988, 49th) to punishing ad valorem taxes (48th, fees and taxes), insurance (37th), and gas prices (44th), the Grand Canyon State has been putting the screws to drivers, landing it in last place by a solid margin.
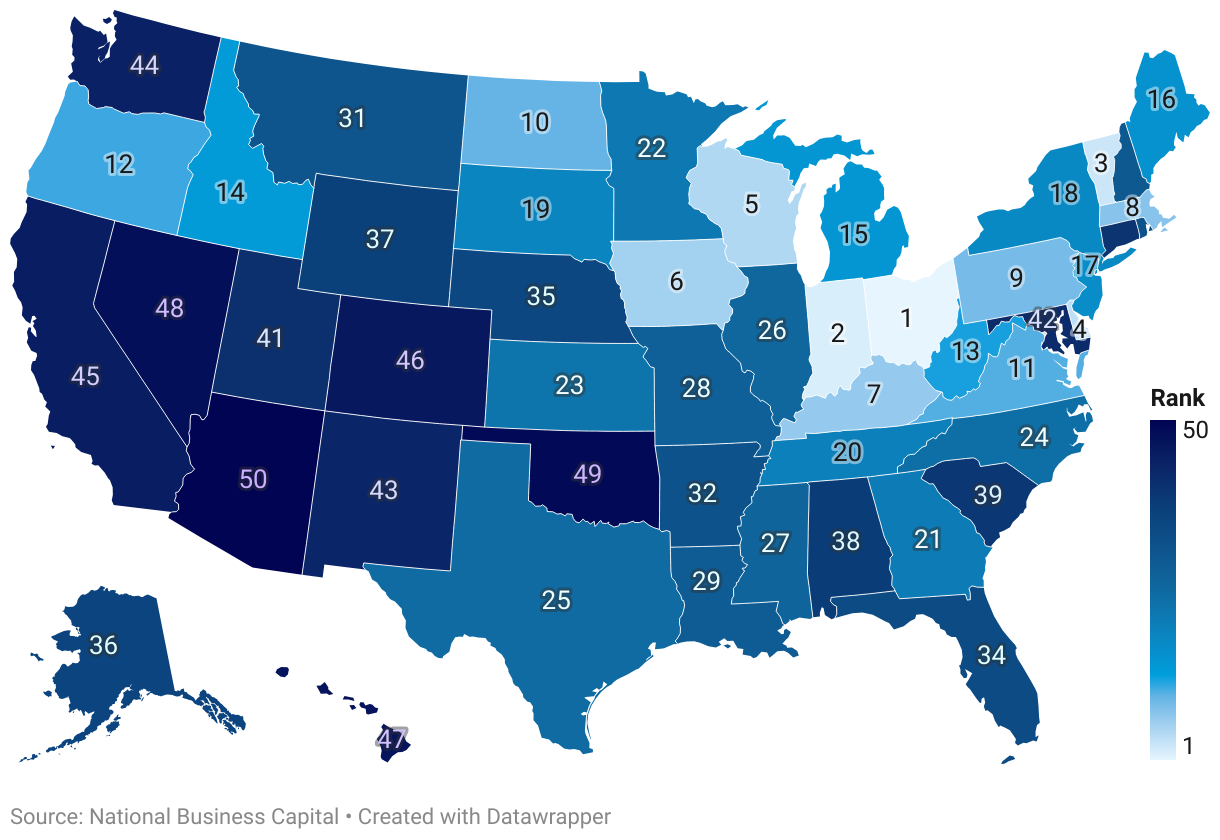
COMPLETE RANKING OF ALL 50 STATES
Methodology
This year’s report brings some changes to our methodology. For example, ad valorem taxes are now grouped with registration fees and other recurring ownership costs. We’re also now taking road conditions into consideration, as these contribute to maintenance costs and driving experience.
To create our rankings, we selected seven metrics to evaluate the typical costs of buying a car within the state. For each metric, the state was given a rank. Each metric was multiplied by a selected weight and then normalized and aggregated to get a score out of 100. The best-performing states have a higher score than the lower-performing ones.
Some cautions with this data. While we tried to model an average buying and registration experience, auto fees are highly variable in each state, depending on the type of vehicle being registered, the locality in which it’s purchased, whether the engine is gas, hybrid, or electric, etc. To create our estimates, we used a hypothetical 2019, 4-ton, gas-powered vehicle for purposes of registration fees and ad valorem taxes.
The seven metrics we chose were:
- Dealer Document Fees (10%): While the ticket price on any given model of a new car tends to be the same from state to state, supplemental fees charged by dealers at the time of sale do vary. Regulation of these fees varies from state to state. Data was sourced from CarEdge.
- Median Used Car Listing Price (30%): Most vehicles sold in the U.S. in any given year are used. Availability and price of used cars vary greatly from state to state. Data was sourced from Autoinsurance.com.
- Average Gas Price (13%): This metric represents the average cost of a gallon of regular gas within the state, 9/5/25. Data was sourced from AAA.
- Sales Tax (12%): This metric represents average sales taxes within the state. Data is sourced from the Tax Foundation. In the case of Georgia, South Carolina, and South Dakota, TAVT, sales tax caps, and excise taxes on car sales were substituted in lieu of the average sales tax, respectively.
- Fees and Taxes (12%): This metric includes typical state-specific, non-sales tax costs that must be paid to get the hypothetical vehicle described above on the road. It includes title, registration, plating, and inspection fees, along with recurring excise, weight, wheel, and/or personal property taxes on vehicles. Data was sourced from the relevant state motor vehicle departments.
- Insurance Costs (13%): This metric is the average annual cost of a standard auto insurance policy within the state in 2024. Data was sourced from The Motley Fool.
- Road Condition (10%): This metric is the percentage of state roads that are considered by the Bureau of Transporation Statistics to be in acceptable condition in 2023. Poor road conditions increase wear and tear on vehicles, leading to more frequent repairs.

Stay informed,
stay ahead
Business news, insights, and data, delivered weekly to your inbox
By clicking Subscribe, I agree to the Terms and Conditions and Privacy Policy, which include our ability to contact you and send you promotional, educational and marketing materials.